Making Meaning of Results
Overview
Use these tools to help your teams make meaning from survey results.

The Groundwater Approach (developed by the Racial Equity Institute)
At YouthTruth, we believe in the power of data to drive meaningful change in schools. To truly understand and address the experiences of students, families, and staff, we need a framework that goes beyond individual challenges to examine the larger systems at play. That’s where the Groundwater Approach, developed by the Racial Equity Institute, comes in.
This framework uses a powerful metaphor—the fish and the pond—to help us shift our perspective. It reminds us that we can’t improve outcomes for individual students without addressing their environment. Check out this video for more info!
Someone to Talk to Tool
One powerful way to make meaning of your data is to observe your results in the context of comparative data. Use this writeable tool to explore your students’ responses by grade level to this highly actionable item in the YouthTruth survey:
“When I am feeling upset, stressed, or having problems, there is an adult at school who I can talk to about it.”
- Locate the “Someone to Talk to” item in the Relationships section of your report.
- Find the percent positive for your students’ responses to the “Someone to Talk to” item at each grade level.
- Record your students’ percent positive in the writeable box for each grade/gender, either above or below the trend line.
What do you notice? Does your data mirror the national trend line or diverge from it? Is anything surprising?
The 4D’s: Defensive, Dismissive, Dejected, and Downplay the Negative
Try this simple — but powerful — activity with your team before you review your YouthTruth data. Naming the 4D’s gives your team a shared vocabulary for recognizing four common reactions adults have to student perception feedback. Introducing the 4D’s can also help your team to adopt a listening-to-learn mindset. As you review your data, try pausing periodically to invite individuals to share if they are experiencing any of the 4D’s. We’ve provided notes in the following 4D’s slide show that we encourage you to adapt and make your own. You can also read more about using the 4D’s in this related backpack resource.
Using the Ladder of Inference
Educators have an ever-increasing stream of data at their fingertips, but knowing how to use this data to improve learning and teaching — how to make it less overwhelming, more useful, and part of an effective collaborative process — can be challenging.
Data Gallery Walk Facilitation Guide
The Data Equity Walk toolkit from The Education Trust—West can be used to dive into your school or district’s data to explore gaps between how different groups experience school.
Diving Into the Data
The Affinity and Question Formulation Technique Protocols
Data Wise, edited by Kathryn Parker Boudett, Elizabeth A. City, and Richard J. Murnane, is a step-by-step guide to using assessment results to improve teaching and learning. We’re highlighting two of our favorite and most-used protocols to help you and your teams make meaning from survey results:
- The Question Formulation Technique – useful for helping a group of people fully explore an issue before jumping in to a discussion.
- The Affinity Protocol – useful for facilitating a group hypothesizing session to explore what may underlie an identified issue in order to work towards solutions.
Learning from Data Protocol
Learning from Data is a tool to guide groups of teachers discovering what students, educators, and the public understand and how they are thinking. The tool, developed by Eric Buchovecky, is based in part on the work of the Leadership for Urban Mathematics Project and the Assessment Communities of Teachers Project. Use this protocol for:
- Setting norms and getting started with data reflection
- Describing your data and gathering information
- Interpreting your data and question generation
- Planning next steps and strategies
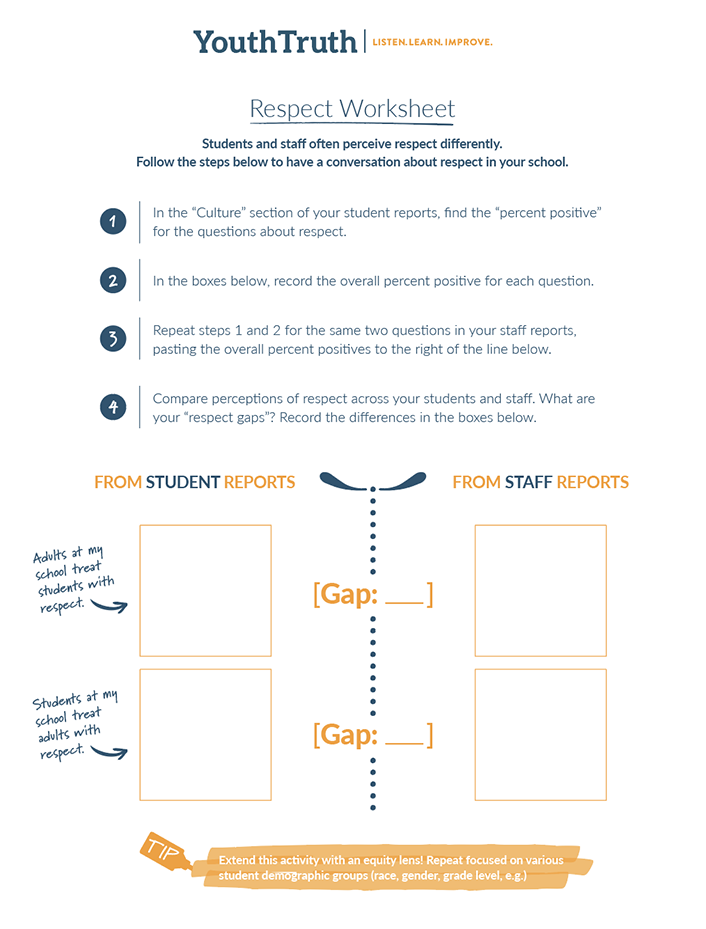
Respect Worksheet
This worksheet guides you through a process to identify potential gaps in the perception of respect between students and staff in your YouthTruth reports. Use it to facilitate constructive conversations in the pursuit of cultivating a culture of courtesy, care, and appreciation within your community.


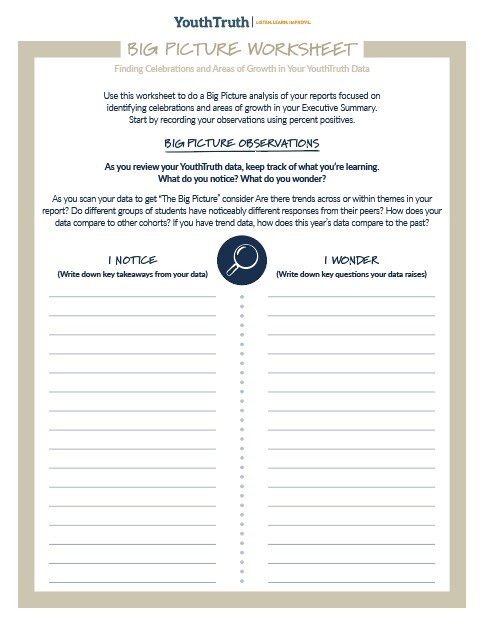
Big Picture Worksheet
Use this worksheet to do a Big Picture analysis of your reports focused on identifying celebrations and areas of growth in your Executive Summary.